1.Introduction / Problem Statement
The decision this work supports, and why it needs ranking, not just flags.
This paper's case study is a real, common shape of FlyRank content problem: a client
publishes far more content than any reviewer can check by hand, and no one currently has a
trustworthy way to say which pages to look at first. In this portfolio, 54.2%
of eligible pages carry a trend_direction == "down" label — thousands of
candidate pages competing for a reviewer's limited attention. Of those, 16,726
pages (55.8%) clear the visibility floor that makes them worth reviewing at all.
At a policy assumption of 50 pages reviewed per week, working that list flatly, in no
particular order, would take roughly 335 weeks — well over six years. That
gap between "how much needs review" and "how much capacity exists to review it" is the
concrete, quantified version of the lane this paper's research question came from, and it's
the problem every result below is trying to shrink.
The real decision isn't "is this page declining?" — it's "of everything declining, which handful should someone look at this week?" That's a ranking problem, not a classification problem, and it's why this paper reports precision@K throughout rather than plain accuracy: a content strategist doesn't act on every row in the dataset, only on the top of a list. A false positive here costs a reviewer 15–30 minutes on a page that turns out fine. A false negative lets a genuinely declining, high-demand page keep losing visibility unnoticed — the more expensive mistake, and the reason recall-aware ranking metrics matter more than a single accuracy number.
2.Data
Which release, which tables, what was excluded, and why.
This paper uses the FlyRank ML Internship starter dataset —
content_refresh_anonymized.csv, 30,000 pseudonymized content items across 32
clients, one row per item, trailing-90-day metrics. It is one of two data releases offered
in the internship program; the other is a ~79-million-row Hugging Face warehouse release.
This paper deliberately used the starter slice only, for reasons explained below.
Eligibility filter: impressions_90d > 0 and
content_age_days >= 90 — real search demand, not a brand-new or silent page.
Deliberately excluded from every model:
trend_direction,trend_pct— these define the label; including them as features would be circular.- Any product decision flag (
health_score,priority_score,action_type) — none are shipped in this slice, by design. - Pseudonymous IDs (
content_id,client_id) — used only for grouping and the holdout split, never as features.
3.Methodology
Assumptions, features, the label, the baseline, the validation design, and the leakage checks.
Label: is_declining_label = (trend_direction == "down") — a
same-snapshot proxy bucket, not a validated future outcome. It is treated as a proxy
throughout, never as ground truth.
Baseline: a transparent, hand-written rule, built only after checking its two inputs against the data:
low_ctr(position 1–20, CTR < 0.5%) tested CONFIRMED — Spearman ρ = −0.376 between position and CTR; average CTR falls from 0.35% at position 1–3 to 0.04% at position 50+.stale(≥180 days since update) tested MIXED — decline rate only ~3 points higher for staler pages (Pearson r = 0.08).
The rule weights the confirmed signal twice as heavily as the mixed one:
score = log1p(impressions_90d) × (2·low_ctr + 1·stale).
Model: Random Forest (class_weight="balanced_subsample",
max_depth=10, min_samples_leaf=25, n_estimators=200,
random_state=42), chosen over logistic regression because the
staleness–decline relationship is non-linear — flat across most tiers, then a jump in a
thin bucket — a pattern a tree ensemble can capture and a linear model cannot. Logistic
regression is still reported as the readable middle step.
Features: 18 numeric (log-scaled volume/traffic, CTR, average position, engagement/scroll rate, age, freshness, word/char count, competition, CPC) and 8 categorical (competition level, content type, intent, and four tier buckets), one-hot encoded.
Validation design: client-grouped 80/20 holdout — 26 training clients, 6 test clients, zero client overlap — rather than a random row split. Pages from the same client share authoring, template, and traffic patterns; a random split lets a model partially memorize a client it is then "tested" on.
Leakage audit: a full attack checklist was run — timeline, label-derived
features, product flags, population selection, base rate, feature-importance sanity,
out-of-fold metrics. As a sensitivity check, deliberately injecting trend_pct
(the column the label is computed from) as a feature pushed ROC AUC from 0.747 to
1.000 — confirming the audit harness would have caught a real leak had one
existed.
4.Results
Model vs. baseline, same split, same metric, base rate visible.
Client-holdout test set: 2,325 rows, 6 clients never seen in training. Test-set base rate
for is_declining_label: 0.391.
| Method | precision@20 | precision@50 | precision@100 | ROC AUC |
|---|---|---|---|---|
| Baseline rule | 0.20 | 0.30 | 0.35 | 0.557 |
| Logistic regression | 0.35 | 0.40 | 0.44 | 0.700 |
| Random forest | 0.70 | 0.68 | 0.70 | 0.747 |
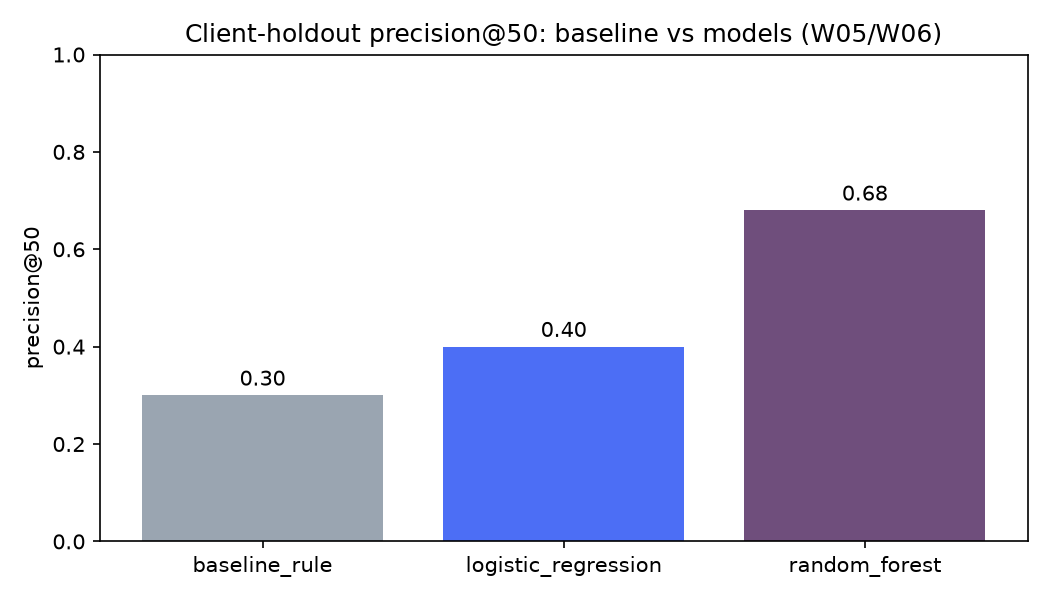
The Random Forest outperformed the transparent baseline on every reported metric on this split — roughly 2× precision@50 (0.68 vs. 0.30). Both sit far above the 0.391 base rate, so the lift is not simply an artifact of an easy label.
What the model leans on: feature importance is spread across several volume/visibility signals (log-impressions, days-with-impressions, average position, content age) — not concentrated on one column, which is what a leaked or circular feature would look like.
Errors, read concretely: the model's false negatives are near-zero-visibility
pages (avg_position == 0, meaning no position data, not rank zero)
where there is simply no positive signal available. Its flagged false positive is a real
high-demand, low-CTR page matching the confirmed CTR-vs-position risk pattern that hadn't
yet tipped into trend_direction == down in this snapshot — a plausible "not
yet," not an obviously wrong call.
5.Limitations & Honest Framing
What this work cannot claim.
- Not causal. No experiment was run. This ranks pages worth reviewing first; it never claims a refresh will recover a page's traffic.
- Proxy label.
is_declining_labelis a same-snapshot bucket, not a measured future decline. A high score means "matches the pattern of currently declining pages," not "will decline next quarter." - Small, single-slice validation. 30,000 rows, 32 clients — the ~79M-row warehouse release was not used. Whether this lift holds at that scale, with a true future-window label, is untested.
- Split matters more than it looks. The same model reports 0.90 under a naive split and 0.68 honestly. Any re-validation must use a grouped or time-aware split.
- New-client extrapolation. The model has only ever seen these 32 clients' patterns; a very different client's top-ranked pages deserve more skepticism, not less.
- No algorithmic claims. Nothing here claims to have predicted Google's ranking algorithm or measured AI search visibility — only observable, pseudonymized search and engagement signals, in one portfolio, over one window.
6.Ranked Recommendations
The action playbook this model produces, and how to use it.
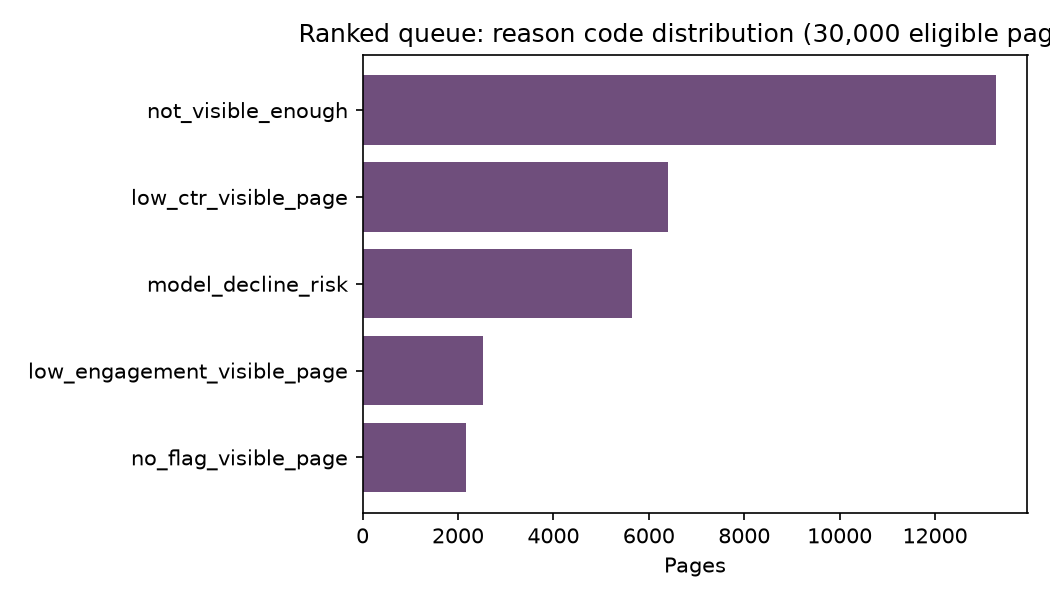
The validated model drives a ranked, reason-coded review queue. Reason codes, in priority order (strongest evidence first):
- 18.8%model_decline_risk (RF probability ≥ 0.65) → refresh priority — the validated signal.
- 21.3%low_ctr_visible_page (visible, position 1–20, CTR < 0.5%) → rewrite title/meta — the confirmed signal.
- —stale_visible_page (visible, ≥180 days since update) → refresh content — the mixed, secondary signal.
- 8.4%low_engagement_visible_page (visible, weak engagement/scroll) → improve structure.
- 51.4%no_flag / not_visible_enough → monitor / no action — not worth review capacity this cycle.
model_probability as an author-performance input;
presenting this ranking to a client as an algorithm-prediction claim; automated page merges
without manual sibling confirmation.
Monitoring: re-check the base rate, the reason-code mix, and precision@50 on a fresh client-holdout whenever new data lands. Retrain or revert to the transparent baseline if precision@50 drifts materially below 0.68 on a genuinely new holdout.
7.Reproducibility
Anyone with the repo can rerun or inspect this work.
Every number on this page traces back to a committed notebook, executed top to bottom, in the public repo:
Random seed fixed at 42 throughout. Metrics receipts
committed at work/outputs/capstone_metrics.json; figures at
work/figures/. To rerun locally: clone the repo, pip install -r
requirements.txt, then execute any notebook top to bottom — every number regenerates
from the one committed starter CSV.
8.Acknowledgments & Data Credit
Built on the FlyRank ML Internship dataset.
All data is pseudonymized and public-safe: no client names, domains, raw URLs, or private queries appear anywhere in this project.